ExLisper@lemmy.curiana.net 11 months ago
underline960@sh.itjust.works 11 months ago
JackGreenEarth@lemm.ee 11 months ago
And none of those y axes start at zero, which is additionally misleading as it exaggerates the level of change.
nokturne213@sopuli.xyz 11 months ago
How many stocks start at zero?
spankmonkey@lemmy.world 11 months ago
Oh no, not less than a balf percent change and stable for a couple hours right after opening!
ExLisper@lemmy.curiana.net 11 months ago
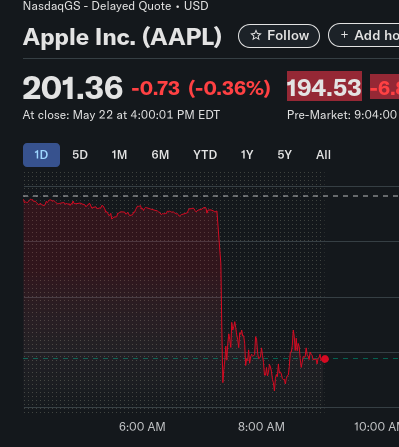
6% actually.
spankmonkey@lemmy.world 11 months ago
Image
ExLisper@lemmy.curiana.net 11 months ago
Yeah, I don’t know what that is. On the right is the actual day-to-day change. As of now the fall settled at about 2.5%: reuters.com/…/us-stock-futures-flat-debt-worries-…
I’m not saying it’s a big drop. It’s just funny how Trump can do this with his truths.