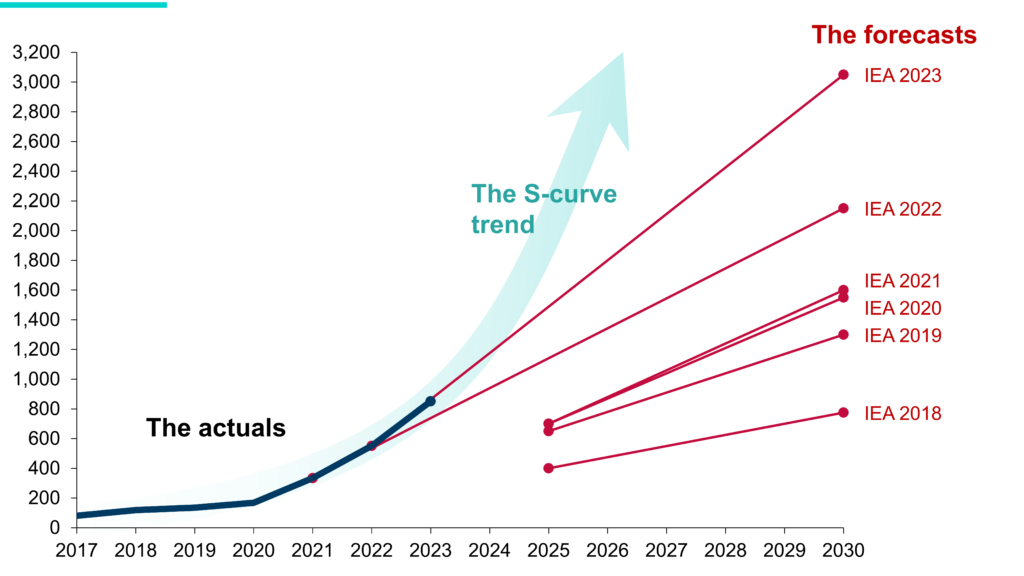
My favorite is the IEA forecast for Solar adoption Image
abhibeckert@lemmy.world 4 months ago
This chart is pretty shocking, and makes IEA look like idiots.
kalleboo@lemmy.world 4 months ago
abhibeckert@lemmy.world 4 months ago
This chart is pretty shocking, and makes IEA look like idiots.
olympicyes@lemmy.world 4 months ago
Correct. You should add the label that this chart compares forecast demand for EVs vs actual demand, along with the revised forecasts.